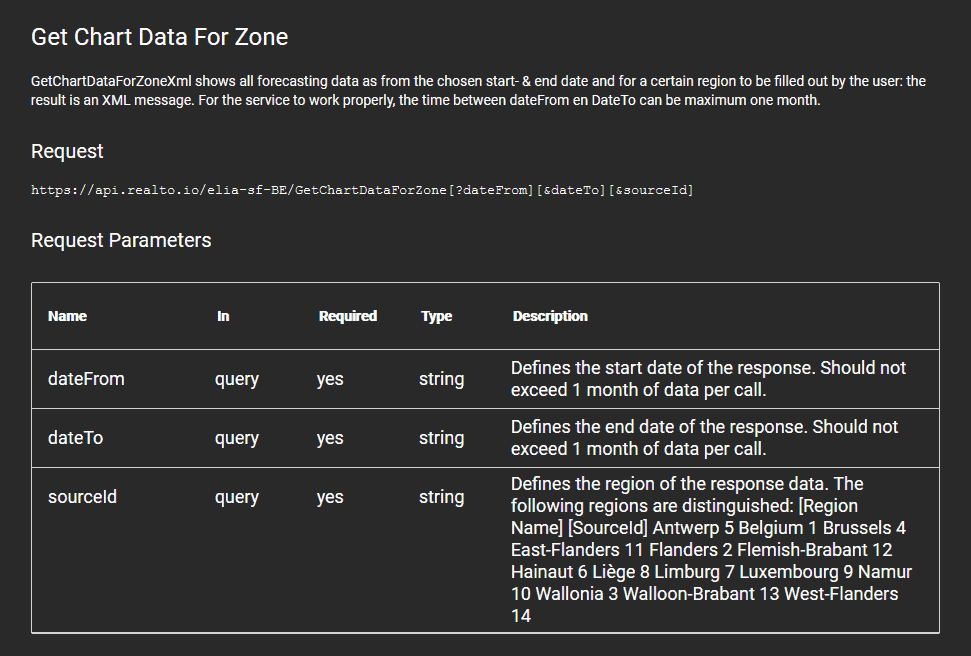
Tutorial: Visualising solar forecast data using Python and web APIs

Web APIs are becoming an increasingly popular standard for communicating data. The days of CSV downloads, file transfers, and even web-scraping are numbered, and for good reason. Before APIs can be used and integrated into any system or process, however, there’s usually an element of investigation and play that needs to happen.

Table of Contents

What you'll need for this tutorial

Understanding how an API works, what data it contains, how the data is structured and formatted are all activities which have to take place upfront. One technique which helps with this is the process of collecting and transforming data into a state which is ready to be visualised. That’s what we’ll cover today 😎

For this tutorial we’re going to create a Python script which pulls Belgian solar forecast data via an API, post-processes it into a Pandas dataframe and finally visualises the output into a timeseries graph.

Why solar forecasts? Well solar forecasts are an interesting time-based dataset to work with since they’re critical for many different actors within the energy sector. For example grid operators, renewable asset owners/operators/developers, traders, smart buildings, energy management systems, the list goes on and on.

So let’s begin!


What you’re going to need
 
Querying the Elia solar forecast API using Postman

Before we get into any coding, let’s first take a look at the API which Elia (the Belgian Transmission System Operator) has created. On the technical operations page you can see that there’s only one operation/endpoint to integrate and a variety of parameters we can play with.

Elia Solar Forecast API

Let’s boot up Postman and create a request using the following query parameters:


Query Parameter

Value

dateFrom

2021-03-07

dateTo

2021-03-15

sourceId

1


We also need to include an API subscription key (retrieved under the “My Subscriptions” area on the re.alto portal). This needs to be included in your request header with the following key-value pair:

OCP-Apim-Subscription-Key” : “YOUR-API-TOKEN

Hit run and your Postman client should get a response. Mine looks like the following:

Okay great, so now we have a fairly good idea of what data the API contains and also what post-processing work we’ll need to be done before we can visualise the output.

Step one - Setting up the python script and details

Over to our Python script, let’s start of by defining our imports and variables.

## script.py

# imports

import requests
import pandas as pd
import re
import matplotlib.pyplot as plt
import seaborn as sns

# inputs

token = ‘YOUR_API_TOKEN_HERE’
endpoint = ‘https://api.realto.io/elia-sf-BE/GetChartDataForZone’
sourceId = 1 # 1 = Belgium
dateFrom = ‘2021-03-07’
dateTo = ‘2021-03-15’

A note on some of the packages here, we’re going to be using “requests” to actually call the API. “re” will be used for running a RegEx query which is needed for our post-processing. Pandas will be used to create the data structure and finally seaborn will be used to create the timeseries plot at the end.

Step two - Fetching and preparing the data

Next, let’s query the API, convert and set-up our dataframe:

# call API and set-up DataFrame

response = requests.get(endpoint, headers={‘OCP-Apim-Subscription-Key’: token}, params={‘dateFrom’:dateFrom, ‘dateTo’:dateTo, ‘sourceId’:sourceId})
json = response.json()
data = json[‘SolarForecastingChartDataForZoneItems’]
df = pd.DataFrame(data)

Here we’re calling the API and then taking the “SolarForecastingChartDataForZoneItems” array and converting it into a Pandas DataFrame. Let’s take a look at what that produces:

Python Pandas DataFrame

Step three - Plotting a timeseries graph and visualising the output

One last thing we need to do is append a proper timestamp to each row. You can see that a Unix epoch DateTime currently lives in the StartsOn column in a JSON syntax. Let’s go through each row, parse the DateTime string and pull the numbers out (using RegEx), convert this into a Pandas timestamp, and finally append the new column to the DataFrame.

# create timestamps

dates = []

for index, row in df.iterrows():
dates.append(pd.to_datetime(re.findall(“\d+”, row[‘StartsOn’][‘DateTime’])[0], unit=’ms’))

df[‘DateTime’] = dates

Once that’s done the data is ready to be visualised!

Plotting a timeseries graph and visualising the output

There’s a couple of Python packages that exist for visualising data- the one we’re using is a package called seaborn. Check out some of the visuals in their examples gallery for inspiration. Since our DataFrame is set-up, getting a timeseries graph is simply a case of defining what columns we want to plot + any settings we want to play with (e.g. colours, titles, sizes, etc). Let’s keep it simple:

# visualising

new_df = df[[‘WeekAheadForecast’, ‘DayAheadForecast’, ‘MostRecentForecast’, ‘RealTime’, ‘DateTime’]]
new_df.set_index(‘DateTime’, inplace=True)
sns.set_style(“darkgrid”)
fig, ax = plt.subplots(figsize=(10, 10))
sns.lineplot(data=new_df, ax=ax, palette=”tab10″, linewidth=2.5)

This outputs the following graph:

Tutorial: Visualising solar forecast data using Python and web APIs

You can see the forecasts become more accurate the closer you are to the forecast date… Who would have guessed?

And voila, that’s it!


In summary: we queried the solar forecast API, post-processed the data, and visualising the output on a timeseries graph.


Hope this tutorial helped and if you have any questions or feedback please feel free to reach out. Thanks for reading!


The full Python script

You can find a copy of our script on our GitHub page.

Explore more

API

What is an API?

API hub What is an API? The term API is an acronym, and it stands for “Application Programming Interface.” An API is a vital building block in any digital transformation strategy, and one of the most valuable in achieving scale, reach and innovation. Behind every mobile app and online experience,

Read More »

API

API

A guide to monetising APIs

API hub A guide to monetising APIs In this guide learn about monetising energy APIs, and their commercial value as a new channel for monetising existing digital assets and data. APIs aren’t new. In fact, they’ve been around for quite a while, embraced fully by industries from all new digital

Read More »

API

APIs in energy

API hub APIs in energy Digitalisation in the energy sector. Unlike other industries where digitisation is the norm, the energy sector is a child by comparison.  In many countries, electricity is still purchased via a sales representative using a paper contract. Many energy retailers, (renewable) energy producers or grid operators

Read More »

API

API

re.alto Talks Part II

API hub re.alto Talks, Part I: Realising the energy transition in times of change This webinar is Part One of a three-part series on “Realising the energy transition in times of change”. https://youtu.be/YBdnui2y904 Explore more

Read More »

API

API

re.alto Talks Part III

API hub re.alto Talks, Part III: The benefits of an API marketplace in energy This webinar is Part Three of a three-part series on “Realising the energy transition in times of change”. https://youtu.be/C2IRj699eWg Explore more

Read More »

API

API

re.alto API overview

API hub re.alto API overview re.alto energy – Technical Setup for Existing APIs On the re.alto platform, individual Users can search for, and subscribe to a Provider’s API products. These subscriptions are monitored, tracked, and (if monetised) billed and settled individually by the re.alto platform.   Each subscription made by

Read More »

API

Frequently asked questions

API hub re.alto Marketplace FAQ What is the re.alto API marketplace? The re.alto marketplace is a marketplace for digital energy products and services, delivered via APIs. You can register as a provider or a consumer/user. As a provider, your digital products via APIs are uploaded to the re.alto marketplace, where

Read More »

API

Energy Quantified and re.alto case study

API hub Energy Quantified and re.alto The API-led approach to digital scale and industry growth As decentralisation of the energy market drives the rise of a host of smaller industry players, easy access to digital products at volume is now an essential factor for the rapid scalability desired by those

Read More »

API

APIs are everywhere – short animation

API hub APIs are everywhere – short video animation We are in living in an increasingly API-centric world. APIs are everywhere you look – and you might not even realise it. Need evidence? Gartner considers API management tools an essential component of the unrealized hybrid integration platform (HIP), currently an

Read More »

API

Adopting an API as a product mindset with APIs

API hub Adopting an ‘API as a product’ mindset with APIs APIs have enormous potential to open companies up to new revenue streams, unlock new markets and extract value from existing assets. To fully realise this potential however, APIs need to be lifted out of the sole domain of the

Read More »

API

Three things you may not know about APIs

API hub Three things you may not know about APIs API. Application Programming Interface. It is the communications channel between two web-based applications, allows the exchange of data without any connecting physical infrastructure. APIs lie at the very heart of digital transformation. According to the 2020 State of the API

Read More »

API

Alternative APIs for Dark sky

API hub Alternative APIs for Dark sky and the strategic value of weather forecasting data in energy In this article you’ll be introduced to weather data use cases and the importance of weather data within the renewable energy and digital landscape.  We also do a deeper dive into alternative APIs

Read More »

API